Title: Exploring the Process of Creating Water Resources Monitoring Data Maps
Title: Exploring the Process of Creating Water Resources Monitoring Data MapsWater resources monitoring data maps are an essential tool for understanding water resources and their usage. The process of creating such maps involves several steps, starting with collecting data from various sources such as water treatment plants, rivers, and lakes. This data is then organized and analyzed to identify patterns and trends in water usage.Once the data has been analyzed, it is used to create a visual representation of the water resources. This can be done using various software programs that allow users to manipulate and visualize the data. The resulting map provides a clear picture of the water resources and their usage, making it easier for policymakers to make informed decisions about how to manage them.The process of creating water resources monitoring data maps is not without its challenges. One of the biggest challenges is collecting accurate data, especially in remote or hard-to-reach areas. Another challenge is ensuring that the data is accurate and up-to-date, as water resources can change rapidly over time.Despite these challenges, creating water resources monitoring data maps is an important step in managing our finite water resources. By providing a clear picture of water usage, these maps help policymakers make informed decisions about how to manage and conserve our precious water resources.
Water is a fundamental resource for life on Earth, and its management is crucial to ensure its sustainability. One of the essential tools in monitoring water resources is data mapping. This article aims to explore the process of creating water resources monitoring data maps, including the importance of data collection, analysis, and visualization.

1、The Importance of Data Collection for Water Resource Monitoring
Data collection is the cornerstone of water resource monitoring. It involves collecting various types of data related to water resources, such as water levels, flow rates, temperature, dissolved oxygen (DO), pH value, and more. The accuracy and relevance of this data are critical for making informed decisions about water management practices.
There are several methods for collecting water resources data, including field surveys, remote sensing, and laboratory testing. Field surveys involve physically visiting water bodies and collecting data by hand or using specialized equipment. Remote sensing techniques use satellite imagery to detect changes in water features and collect data from a distance. Lab testing allows researchers to measure specific parameters of water quality directly.
Once collected, data must be stored and organized in a way that makes it accessible for analysis and visualization. This can be achieved through the use of databases, spreadsheets, or specialized software programs designed for water resource monitoring.
2、Analyzing Water Resource Data for Insights
After collecting and organizing water resource data, the next step is to analyze it to identify patterns, trends, and anomalies. This process involves using various statistical tools and techniques to derive insights from the data. Some common methods for analyzing water resource data include:
a) Descriptive statistics: These provide general information about the data, such as means, medians, and standard deviations. They are useful for understanding the basic characteristics of the water resource being monitored.
b) Inferential statistics: These allow researchers to make predictions about the population based on the sample data. They are used when there is a need to generalize findings to larger populations or when there are assumptions about the population structure.
c) Regression analysis: This technique helps determine the relationship between two variables by modeling the data as a function of one variable. It is useful for identifying factors that affect water quality and predicting future trends.
d) Time series analysis: This method focuses on the sequence of data points over time and identifies patterns and trends that occur within those sequences. It is useful for understanding long-term changes in water quality and identifying seasonal variations.

e) Machine learning algorithms: These advanced statistical techniques use artificial intelligence to identify patterns and relationships in data that are not easily discernible by humans. They are particularly useful for complex datasets with multiple variables and large amounts of data.
3、Visualizing Water Resource Data with Interactive Maps
Once analyzed, the next step is to visualize the water resource data in an interactive map format that is easy to understand and interpret. There are several types of interactive maps that can be used for this purpose, including:
a) Geographic information systems (GIS) maps: GIS maps display data layers on top of spatial data, allowing users to see how different variables relate to each other at a geographic scale. GIS maps are particularly useful for exploring spatial patterns in water resource data.
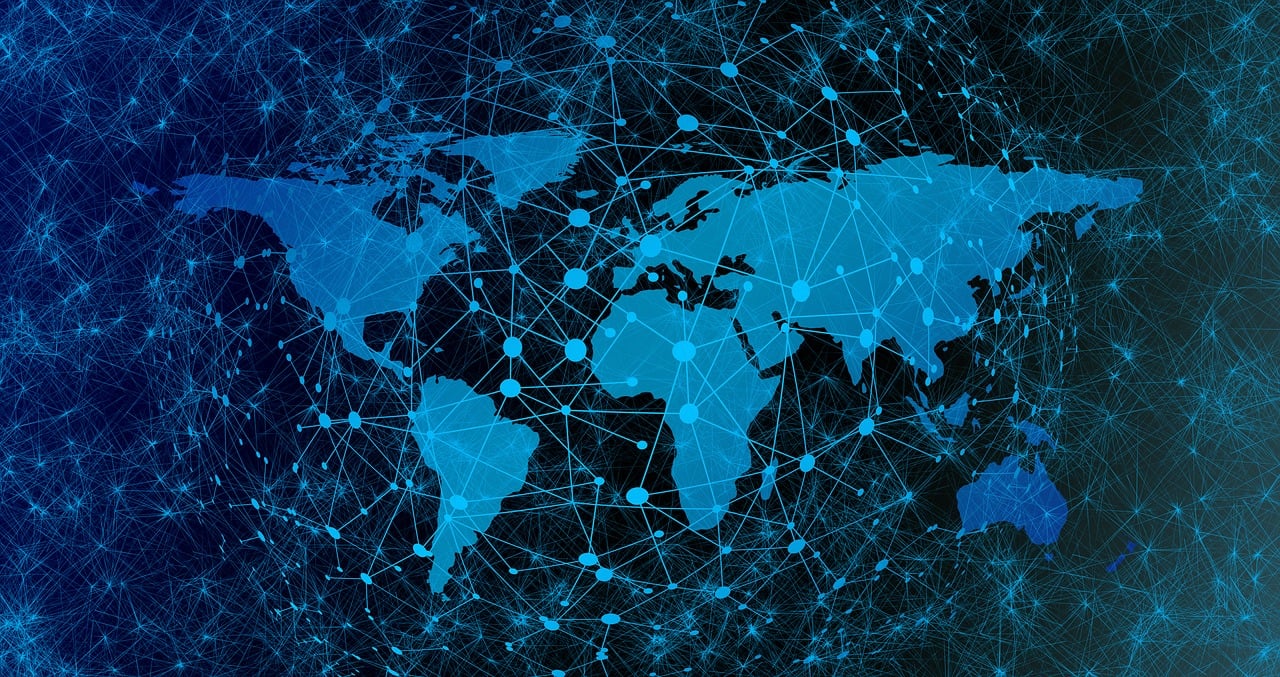
b) Network graphs: Network graphs show the connections between nodes in a network, such as water treatment facilities or monitoring stations. They are useful for identifying areas of overlap or redundancy in the network and optimizing resource allocation.
c) Heat maps: Heat maps use color gradients to represent data values and highlight patterns or outliers in the data. They are useful for quickly identifying regions with high or low water quality scores.
d) choropleth maps: Choropleth maps display data values on a map using polygons or other shapes based on regional boundaries or population density. They are useful for understanding how different areas of the water body respond to changes in water quality or management practices.
In conclusion, creating water resources monitoring data maps involves several steps, including data collection, analysis, and visualization. By leveraging these steps, researchers can gain valuable insights into water quality trends and make informed decisions about water management practices. As technology continues to advance, it is likely that new methods and tools will be developed to enhance the accuracy and effectiveness of water resource monitoring data maps even further.
Articles related to the knowledge points of this article:
Hydrological Sediment Monitoring and Research
Hydrological Monitoring Engineers and Hydrographic Surveyors: The Waterwork Professionals
Title: Regulations and Standards for Hydrogeological Monitoring Boreholes
Hydrological Emergency Monitoring: Characteristics and Challenges
Title: Application for Purchase of Mining Water Monitoring Equipment